
Miles per Gallon
Distance traveled per gallon of liquid fuel under a stated test or measured driving period.
- Higher values indicate less fuel per mile
- The scale is mathematically nonlinear
- Diesel and gasoline remain different fuels
Vehicle fuel economy matters because every mile repeatedly converts fuel or electricity into operating cost, range, and refueling time. A modest consumption difference can accumulate over years, while a vehicle with poor efficiency exposes its owner more strongly to fuel-price changes and route interruptions.
The printed rating is a standardized comparison, not a promise. Speed, short trips, temperature, traffic, elevation, wind, tires, payload, towing, roof cargo, cabin conditioning, and charging losses can move real consumption. Read MPG together with gallons per 100 miles, and read electric or plug-in vehicles with kilowatt-hours, MPGe, range, and gasoline operation kept distinct.
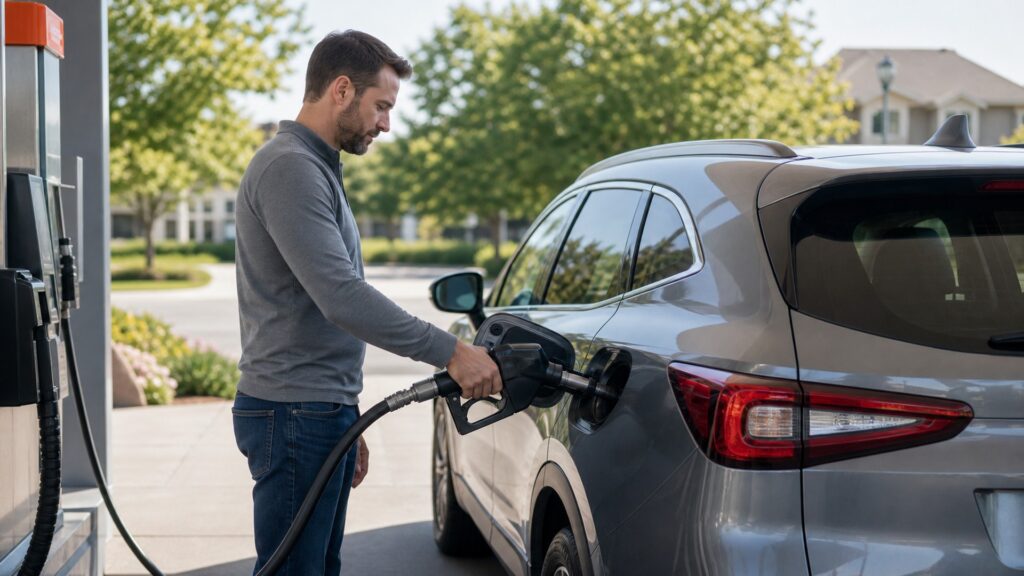
Fuel economy becomes useful when standardized ratings are translated into fuel or electricity consumed over the owner's actual distance, route, load, climate, and energy prices.
Tip: MPG is reciprocal: improving from 15 to 20 MPG saves more fuel over the same distance than improving from 35 to 40. Gallons per 100 miles makes that unequal effect visible.
These measures keep distance, energy, test conditions, and cost from collapsing into one misleading number.
Distance traveled per gallon of liquid fuel under a stated test or measured driving period.
Liquid fuel consumed to travel one hundred miles, the reciprocal view of MPG.
An energy-equivalent distance metric comparing electricity or other energy with a defined gallon-of-gasoline energy quantity.
A weighted result blending standardized city and highway test outcomes for comparison.
Resisting force from moving air that grows strongly with speed and depends on shape, frontal area, and wind.
Energy consumed by heating, cooling, defrosting, lighting, electronics, pumps, and other non-propulsion functions.
Tip: Compare like test methods and exact trims; wheel size, drivetrain, battery, body, and equipment can change a model's certified result.
Annual miles divided by MPG estimates gallons; annual miles multiplied by kilowatt-hours per mile estimates electricity. Applying realistic price ranges shows both expected spending and exposure to price volatility.
Purchase price happens once; energy consumption repeats with every route.
A large tank or battery can create range despite poor efficiency, while an efficient vehicle can travel farther on less stored energy. Range therefore reflects both storage and consumption under the current conditions; the combined rating and highway cycle remain comparison baselines, not storage measures.
Storage answers how much is carried; economy answers how quickly it disappears.
Laboratory procedures hold selected variables sufficiently consistent to compare vehicles. Real routes add grades, winds, traffic, driver inputs, pavement, temperatures, fuels, and accessory demands outside one generalized cycle.
A rating is most honest as a controlled reference point.
Faster airflow, repeated acceleration, warm-up, low tire pressure, added mass, rolling resistance, trailer frontal area, and climate control require more energy. The largest penalty depends on the trip rather than one universal percentage.
Economy is a system response to the task imposed on the vehicle.
Burning more fuel for the same distance generally increases fuel spending, refueling frequency, and carbon dioxide from that fuel. Other emissions depend on fuel, controls, temperature, maintenance, test basis, and upstream energy.
Efficiency is an important consequence, not the vehicle's entire environmental account.
Standardized economy supports comparison; annual distance, load, climate, energy price, and driving pattern determine the owner's outcome.
The vehicle will cover substantial annual distance, fuel or electricity is costly or volatile, refueling access is limited, or work and family schedules make range and stop frequency consequential.
The comparison uses exact trims, realistic city-highway shares, payload and towing needs, seasonal conditions, and consumption-per-distance arithmetic instead of advertising range alone.
A rarely driven vehicle may not recover a large purchase premium through energy savings, while insurance, depreciation, financing, maintenance, repairs, and taxes can dominate total ownership cost.
Fuel economy does not establish safety, reliability, utility, emissions of every pollutant, battery impact, towing suitability, or comfort. Standard ratings also cannot guarantee one driver's result.
Fuel-economy myths usually misuse reciprocal MPG, confuse range with efficiency, or treat a standardized label as a personal guarantee.
Because MPG is reciprocal, the savings depend on the starting point. Moving from very low MPG can eliminate far more gallons over a fixed distance than the same five-point increase at high MPG.
Tank size can extend distance between stops while the engine still consumes more fuel per mile. Compare gallons per 100 miles or measured consumption; storage capacity and conversion efficiency answer different questions.
Standard tests provide a consistent comparison under defined procedures. Temperature, speed, congestion, terrain, wind, tires, load, towing, accessories, trip length, fuel, charging, and individual driver inputs can move actual results.
MPGe expresses distance per energy-equivalent quantity, not gallons purchased. Plug-in comparisons need kilowatt-hours and gasoline tracked in their own operating phases, with actual local prices and charging losses applied separately.
Tip: Translate every claim into energy consumed over a defined distance before attaching cost, range, or emissions consequences.
These answers cover annual savings, rating accuracy, premium fuel, idling, towing, and the records needed to evaluate an exact vehicle.
Divide annual miles by expected MPG to estimate gallons, then multiply by a realistic fuel price. For electricity, multiply miles by wall energy per mile and the applicable tariff, including charging losses.
Weight the ratings by the routes actually driven. Short urban trips emphasize warm-up, stops, and accessories; fast highway travel emphasizes aerodynamic drag. A blended commute may not resemble the published combined weighting.
Use only the fuel grade required or recommended by the manufacturer, then compare measured cost per mile. Any economy difference must offset the price premium; unsupported octane changes cannot be assumed to create savings.
A trailer adds mass, rolling resistance, drivetrain load, and often substantial frontal area and turbulence. Speed, grade, wind, tires, trailer shape, cooling, and transmission behavior determine the penalty for the exact combination.
Record distance and fuel added across many full-fill intervals, noting seasonal fuel, route, load, towing, tires, and maintenance changes. For plug-ins, record wall electricity and gasoline separately instead of relying on dashboard averages alone.
Vehicle fuel economy matters because energy consumed per distance repeatedly shapes operating cost, usable range, refueling frequency, price exposure, and fuel-related emissions across the ownership period.
Use standardized ratings for fair screening, then model gallons or kilowatt-hours over the actual route, climate, load, and annual mileage. Keep storage, range, MPG, MPGe, and total ownership cost as related but distinct measures.
Related explainers connect consumption arithmetic to vehicle energy flow, hybrid operating modes, and the broader body-style variables that change drag, mass, cargo, and route utility.
See where propulsion conversion, tires, braking, thermal limits, and controls consume or recover energy.
Compare how HEVs and PHEVs source and account for gasoline and grid electricity across a trip.
Relate body height, frontal area, mass, tires, and cargo packaging to real highway and city energy use.
Choose a retailer
Prices checked regularly. We may earn a commission at no cost to you.