
Live Data
Values requested from modules and displayed or recorded while vehicle conditions change.
- Update rate varies by tool
- Some values are calculated
- A plausible number can still be wrong
Real-time vehicle diagnostics matter because many faults occur only during a brief change in load, temperature, vibration, speed, or electrical demand. A code may name the system that detected a problem, but a time-aligned stream can show what changed first, what followed, and whether the event can be reproduced.
Streaming more values is not automatically better. Every tool and network has limited bandwidth, and requesting dozens of parameters can slow the update rate until a short dropout disappears between samples. Effective diagnosis selects a small causal set, verifies units, records operating conditions, triggers around the symptom, and then checks the electronic story with physical measurements and controlled tests.
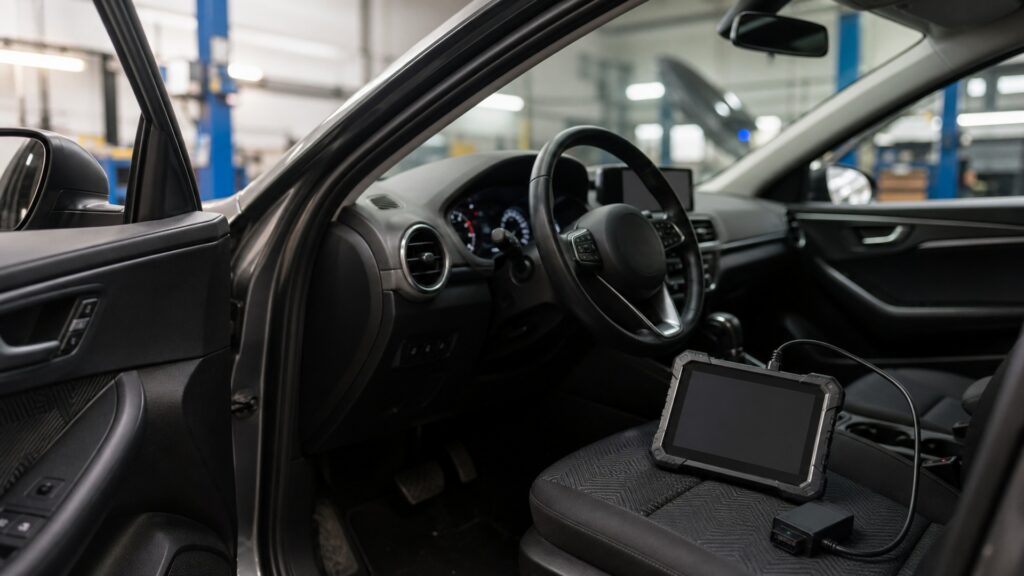
Real-time diagnosis works by framing a hypothesis, choosing decisive signals, preserving the event, comparing cause-and-effect timing, and validating the result outside the scan tool.
Tip: Before driving, configure the logger and use a second person or safe automated capture; watching a diagnostic screen while operating the vehicle destroys the safety of the test.
These terms separate a useful time series from a crowded screen of unrelated numbers.
Values requested from modules and displayed or recorded while vehicle conditions change.
A standardized or manufacturer-defined request for a particular diagnostic value or status.
The number of usable observations captured for a parameter during a unit of time.
A tool function that saves selected parameters with timing information for later review.
A condition that marks or preserves data before and after a diagnostic event.
A diagnostic command that asks a supported module or actuator to perform a controlled action.
Tip: Choose parameters that can disprove the current hypothesis, not every value the tool offers.
Begin with the exact complaint, operating state, recent work, stored codes, freeze-frame, and basic inspection. Then identify signals that describe the suspected input, controller decision, commanded output, and physical result instead of opening every data list.
The data list should represent a proposed mechanism, not the size of the scan tool's menu.
Diagnostic networks schedule many messages while the scan tool sends requests and waits for replies. Adding parameters divides attention, changes polling order, and can create irregular gaps. A narrow list preserves enough temporal resolution to catch a drop or spike.
A smooth slow trace can be an alias of a fast failure rather than proof that the value stayed steady.
Overlaying related traces can reveal whether voltage fell before communication stopped, whether fuel correction preceded a misfire count, or whether a command changed without the expected feedback. Delay must be interpreted against known controller strategy and logging latency.
The earliest visible change is a lead, not a verdict, because unseen physical events may precede it.
A supported command test can isolate an actuator path, while a meter, gauge, smoke test, pressure transducer, or visual inspection checks the physical result. The safest test respects moving parts, heat, high voltage, fuel, lift, and road hazards.
Diagnosis strengthens when independent evidence agrees with the streamed value under a controlled change.
After correcting the cause, repeat the original conditions with the same decisive signals, confirm the symptom is absent, inspect for collateral effects, and allow applicable monitors to run. Save before-and-after files so the repair conclusion remains reviewable.
A repair is verified by restored behavior under the failure conditions, not by an empty code list immediately after clearing.
Streaming can reveal order and intermittency while remaining limited by sampling, calculation, network access, and the test design.
Time series can expose brief dropouts, delayed responses, load relationships, and interactions that a static code or snapshot cannot preserve.
Triggers and repeatable overlays can turn an intermittent complaint into evidence that another technician can inspect and reproduce.
A graph cannot reveal events that were not sampled, distinguish every calculation from measurement, or prove that the earliest visible change is the root cause.
Generic access may omit manufacturer modules, faster native messages, command tests, security functions, and correct labels needed for a complete investigation.
These myths treat screen motion as diagnosis and ignore the sampling process that created it.
A larger list can reduce per-parameter update rate, add network and display clutter, and hide short events. Select the smallest group that represents input, decision, command, feedback, and the operating condition under test.
The tool may have sampled too slowly, repeated stale values, rounded the display, lost messages, or graphed a filtered parameter. Check timestamps, raw units, update intervals, and an independent measurement before accepting steadiness.
It is the first selected parameter that showed change. An unlogged voltage, mechanical disturbance, air leak, heat effect, software decision, or network event may have occurred earlier and caused every displayed response.
Clearing removes evidence and resets monitor status. The original condition must be reproduced, relevant behavior compared, and applicable self-tests completed before the absence of a returning code supports a repair conclusion.
Tip: Make every trace answer a question, then verify its conclusion with another signal or physical test.
These answers cover safe logging, parameter choice, phone apps, graph interpretation, and when a bidirectional test is appropriate.
No. Configure automated logging before movement and have a qualified second person manage any necessary observation. Use secure equipment and a safe route or controlled test environment that does not divide the driver's attention.
Use only the signals needed to represent the current hypothesis, then measure their update intervals. Fast transient questions may need two or three traces; slower thermal or fuel trends may tolerate more.
Yes, for supported generic parameters and careful trend work, but hardware quality, protocol handling, rate, labels, module coverage, security, and application export vary. Validate important findings with appropriate equipment and service information.
They may request different data, apply different scaling, smoothing, units, polling rates, or manufacturer definitions. Compare parameter identity, raw value, timestamp, test conditions, and tool documentation before deciding which display is wrong.
Use it when service information supports a controlled command that can safely separate controller, circuit, actuator, and feedback behavior. Prepare for movement, pressure, heat, high voltage, or fuel hazards before issuing it.
Real-time diagnostics matter because carefully sampled, time-aligned signals can preserve transient behavior and reveal a testable sequence that codes alone cannot show.
Define the symptom, log a small causal set, confirm timing, intervene safely, verify with physical evidence, and repeat the original conditions after repair.
These explainers show where regulated OBD records end, where monitoring begins, and how electronics constrain both.
Review standardized codes, freeze-frame, monitor status, readiness, and the evidence-preservation sequence before live testing.
Compare diagnostic logging with longer-term remote monitoring, alerts, retention, and privacy responsibilities.
Trace the modules, sensors, networks, power, and outputs that determine which live values are available and meaningful.
Choose a retailer
Prices checked regularly. We may earn a commission at no cost to you.